Who and when
Author and timestamp on every note, so a shared review stays readable.
Chrome extension and review hub
Leave a note on any element. It arrives anchored to the component that rendered it, with the surrounding logs.
See what it exports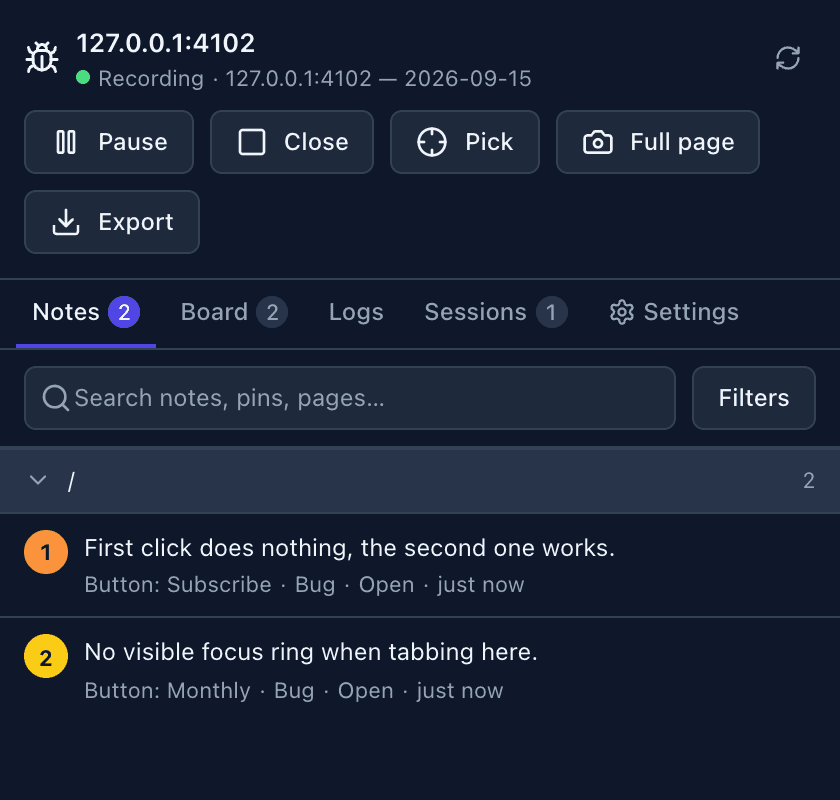


Anatomy of a note
A verified unique selector, the framework component that rendered the element and, on development builds, the file and line it came from.
SubscribeButton in PricingCard
The element, captured on its own.
Console and network from the thirty seconds before you wrote it.
Author and timestamp on every note, so a shared review stays readable.
Page, scroll position and viewport size, because layout bugs depend on all three.
Right-click it. The note is anchored to that component and survives a reload.
Drag a rectangle. FrontBug lists every component inside it, ranked by overlap.
Full height in one image, sticky headers handled, with the pins drawn on top.
noise   Sentry is not configured
noise   GET /favicon.ico 404
noise   net::ERR_BLOCKED_BY_CLIENT
high    POST /api/checkout 500
2.1s after your click on SubscribeAn unconfigured reporter and a missing favicon are not your bug. FrontBug keeps them, summarises them by pattern, and puts the first-party failure that followed your click at the top.
Nothing is discarded. You can always open the full log in the bundle.
Local by default
Capture, annotate and export on a plane or on a locked-down client network. Everything stays in your browser until you export a bundle or connect a project.
One folder. Readable on its own, and shaped so a coding agent can work straight from it.

Whoever finds it works in the browser, next to the page. Right-click, type, move on. No ticket form, no screenshot pasted into a chat.
Whoever fixes it opens a folder that already says which component broke, what the console said and what the user had just done.
The extension runs today: sessions, element and region notes, component fingerprints, full-page capture, log triage and the exported bundle all work in Chrome. The review hub for teams is specified and not built yet. This page will say so until it changes.